User Guide
[Main Window][Toolbar][XML Viewer][Translation][File Menu][Edit Menu][Algorithm Menu]
1. Main Window
Upon program activation, the user will be presented with the main window, depicted in Figure 1. The main window presents the toolbar, drawing panel and xml viewer. All the operations can be accessed via the menu.
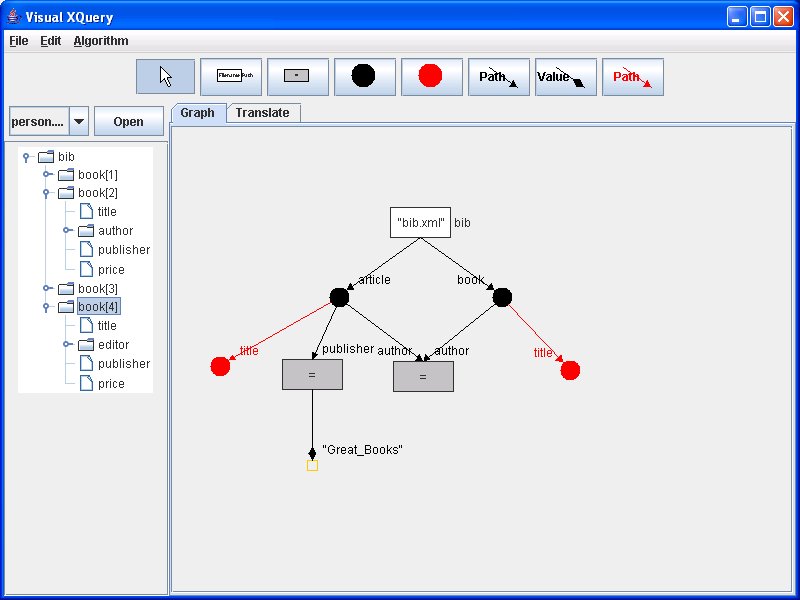
Figure 1. Main Window
2. Toolbar
The toolbar shown in figure 2 provides all the tools for drawing the query diagram. A node is drawn by selecting the node tool and clicking on the graph panel. An edge is drawn by selecting the edge tool and clicking on a start node and an end node.
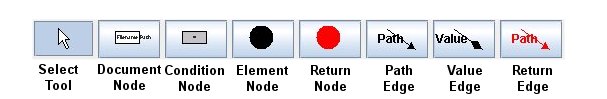
Figure 2. Toolbar
2.1 Select Tool
Used to select and move graph components in the draw panel for editing.
2.2 Document Node
Used to create document nodes which acesses xml files specified in filename attribute and select elements using the pathname attribute to locate nodes.
2.3 Condition Node
Used to specify the general and value comparison operator through its condition attribute. A condition Node is only valid when it is connected to at least two edges.
2.4 Element Node
Correspond to element nodes in xml file.
2.5 Return Node
Used to specify query output node. A return edge is only valid when it is connected to a return edge.
2.6 Path Edge
Used to create a parent-child relationship between two nodes. The elements is selected using the pathname attribute to locate nodes.
2.7 Value Edge
Valid only when connected to a condition node. Used to specify an absolute value for comparison with element.
2.8 Return Edge
Valid only when connected to a return node and an element node. Select elements using the pathname attribute to locate nodes for output.
3. XML Viewer
The XML Viewer shown in figure 3 displays the hierarchy structure in a xml file. The user can use the combo box to select file for viewing and only one file can be viewed at one time.
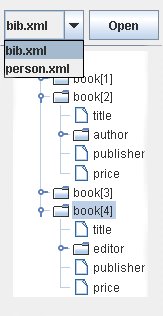
Figure 3. XML Viewer
4. Translation
On selection of the translation tab, the program will translate the query graph into the relevant XML Query Language as shown in figure 4. Users can edit,paste from clipboard,copy to clipboard or save the result into an xquery file (.xq). *Note: Changes edited will not be reflected in graph.
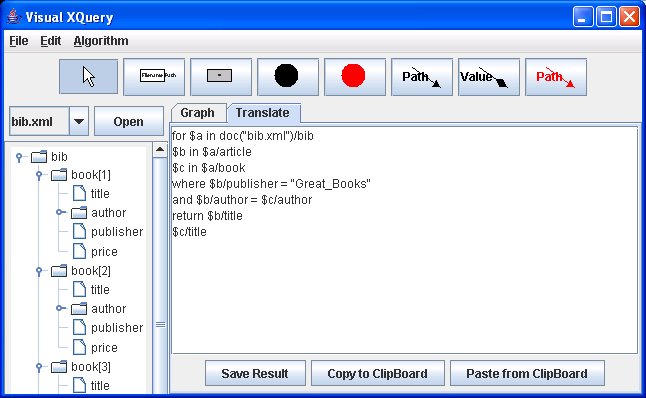
Figure 4. Translation
5. File Menu
5.1 File > New
Clear the draw panel and create a new draw panel.
5.2
File > Open
Open a Visual XQuery graph file (.vxq) for editing.
5.3 File > Save
Save current graph on drawpanel into a Visual XQuery graph file (.vxq).
5.4 File >Import
Import a xquery file (.xq) into program for display into a Visual XQuery graph.
6. Edit Menu
6.1 Edit > Delete
Delete selected graph node or edge from graph.
6.2 Edit > Properties
Edit selected graph node or edge properties. Also can be performed through right-click on selected node or edge.
7. Algorithm Menu
Offers four translation algorithms
7.1 Simple Translation - provides basic graph to XQuery translation
7.2 Forward Translation - offers translation of reverse-axis path. Limited to 8 types of reverse-axis path listed in documentation.
7.3 Canonical Forward Translation - offers translation of reverse-axis path rewriting into canonical form. Supports path with multiple axes.
7.4 Enhanced Canonical Forward Translation - enhancement of canonical forward translation algorithm. More optimized query with reduction in joins, loops and document accesses.
Web site and all contents © Copyright Visual XQuery 2007, All rights reserved.
Last Updated: 03 May 2007
|